AWS Cloud Operations Blog
From 2 AM alarm to answer: Security Triage with AWS DevOps Agent
Security incident triage usually starts cold. An Amazon CloudWatch alarm fires at 2 a.m. because an AWS Identity and Access Management (IAM) access key just created another access key. The responder spends the first 30 minutes assembling evidence from AWS CloudTrail, Amazon CloudWatch Logs, and Amazon Virtual Private Cloud (Amazon VPC) Flow Logs before deciding whether the alarm matters. The decision itself is quick. Assembling what you need to make it is not.
AWS DevOps Agent already does that correlation for operational incidents, and this post applies the same loop to security alarms. To be precise: the agent investigates and proposes. It does not detect threats or carry out response. Amazon GuardDuty detects, AWS Security Hub tracks posture, and AWS Security Incident Response runs the case from detection findings. The alarms here never reach a detection service. The agent takes manual evidence gathering off the CloudWatch alarms you wrote yourself.
IAM enforces that boundary, so it does not rest on how the agent behaves. Every time the agent assumes your role it passes a session policy called the permission guardrail, and its effective permissions are the intersection of your role policy and that guardrail. Write actions such as s3:PutObject and ec2:TerminateInstances are absent from the guardrail, so the agent cannot call them even if your role grants them.
This post shows how to route security-relevant CloudWatch alarms into AWS DevOps Agent, walks through three investigations mapped to the OWASP Top 10:2025, and marks where evidence gathering ends and your security team takes over. Each investigation answers the four questions that decide severity: who acted, what changed, what is exposed, and whether anything used it. One note on vocabulary: the agent uses triage for its own correlation step, so here the word means the human judgment about whether an alarm is real.
Solution overview
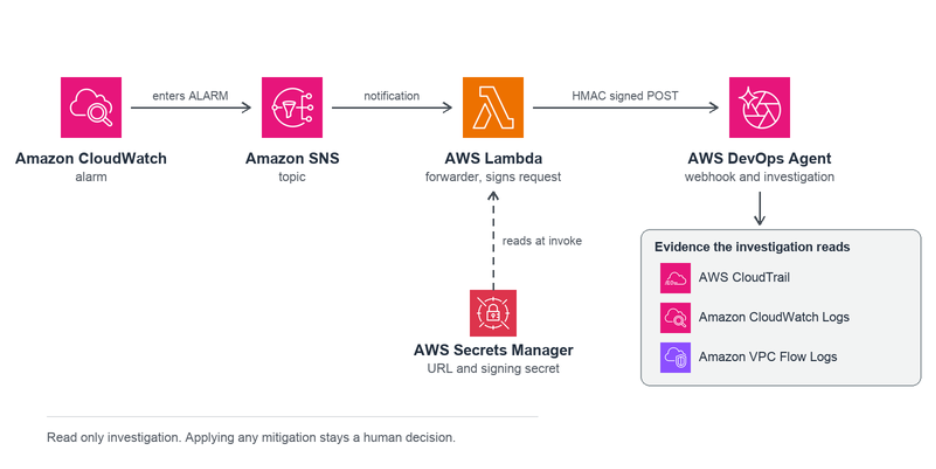
A CloudWatch alarm action can invoke a target such as Amazon Simple Notification Service (Amazon SNS) or AWS Lambda, but it cannot issue an HTTP request, so something has to sit between the alarm and the AWS DevOps Agent webhook. A small Lambda function does that.
A generic webhook takes either HMAC or an API key sent as a bearer token. This post uses HMAC because it signs the payload and carries replay protection through the signed timestamp.
Here the alarm publishes to an Amazon SNS topic and the topic invokes the forwarder. The topic is optional, since an alarm can invoke Lambda directly. It earns its place by retrying delivery when the function is throttled, fanning out to email or chat without touching the alarm, and letting several accounts feed one pipeline. Without those, point the alarm straight at the function.
Figure 1 shows the pipeline end to end. The forwarder reads the signing secret from AWS Secrets Manager before posting the signed request that starts the investigation, and the investigation reads AWS CloudTrail, Amazon CloudWatch Logs, and Amazon VPC Flow Logs. The diagram notes that investigation is read only and that applying any mitigation stays a human decision.
Three scenarios follow, each producing a different class of evidence. The first hinges on Amazon Simple Storage Service (Amazon S3) object reads, the second on network traffic, the third on application logs.
| OWASP category | What happens | Evidence the agent reads |
|---|---|---|
| A01:2025 Broken Access Control | A compromised access key runs reconnaissance, creates a second key, attempts a policy attach, then reads Amazon S3 objects in bulk | CloudTrail management events and S3 data events |
| A02:2025 Security Misconfiguration | A security group opens port 22 to 0.0.0.0/0 | CloudTrail, then VPC Flow Logs to test whether anything used the opening |
| A05:2025 and A07:2025, with an A09:2025 finding | Injection and credential stuffing against an API, where the logs cannot confirm the outcome | Structured application logs in CloudWatch Logs |
Solution walkthrough
Prerequisites
- An AWS account you can treat as a sandbox. Do not run this in production.
- An Agent Space in AWS DevOps Agent. Check Supported Regions for the current list and per-Region feature availability, and the CLI onboarding guide for creating a space and associating your account.
- A CloudTrail trail delivering to Amazon S3 and to a CloudWatch Logs log group, with S3 data events on for the lab bucket. The metric filters read the log group; the object count comes from Amazon S3.
- VPC Flow Logs publishing to a log group.
- AWS Command Line Interface (AWS CLI) version 2, and permission to deploy AWS CloudFormation stacks.
Time and cost: Budget about 45 minutes. Running cost is roughly $0.15 if you complete and clean up the same day, dominated by the t3.micro EC2 instance (about $0.01 per hour) and CloudWatch Logs storage and ingestion. The S3, Lambda, and SNS usage falls within or near the Free Tier. Secrets Manager has no free tier and bills at $0.40 per secret per month, prorated by the hour, so a secret deleted the same day costs about a cent. The Clean up section removes everything, including the secret.
Deploy the lab
The CloudFormation template in the companion repository provisions the following:
- A payment API on Lambda behind an Amazon API Gateway REST endpoint, writing structured JSON logs for authentication failures, rejected input, and successful requests.
- An Amazon S3 bucket seeded with generated records under the
customer-records/,payment-data/, andinternal-reports/prefixes. - A demo IAM user with deliberately narrow permissions. Its access key is created at deploy time. The key ID is a stack output and the secret goes to AWS Secrets Manager, so no credential is readable from the stack and none is stored in the repository.
- A t3.micro Amazon Elastic Compute Cloud (Amazon EC2) instance in its own VPC, with Flow Logs enabled.
- Three CloudWatch alarms, an SNS topic, and the forwarder Lambda function.
Deploy it:
aws cloudformation deploy \
  --template-file template.yaml \
  --stack-name devops-agent-security-triage \
  --capabilities CAPABILITY_NAMED_IAM \
  --parameter-overrides DemoUserPassword=<choose-a-strong-password>
Pass a strong throwaway value for DemoUserPassword. It applies only to the sandbox demo user, which you delete in the Clean up section.
The repository README covers the deploy parameters, the metric filter patterns, and the three scripts. A second file, OWASP-MAPPING.md, traces each category from the script that generates it through to the finding, so you can follow one category without reading the whole template.
Connect the alarms to the agent
In the AWS DevOps Agent console, open your Agent Space, choose the Capabilities tab, and configure a webhook. Choose HMAC, then save the URL and the signing secret, because the secret is shown once. Store both in AWS Secrets Manager and give the forwarder function read access to that secret.
The function receives the SNS notification, builds a payload the webhook accepts, signs it, and posts it.
{
  "eventType": "incident",
  "incidentId": "cw-alarm-iam-key-created-20260812T0214Z",
  "action": "created",
  "priority": "HIGH",
  "title": "Unexpected CreateAccessKey by sectriage-demo-user",
  "description": "Alarm SecurityTriage-CreateAccessKey entered ALARM in account 111122223333, us-east-1.",
  "service": "payments-api",
  "data": { "alarmName": "SecurityTriage-CreateAccessKey" }
}
The forwarder joins the timestamp and the JSON body with a colon, in the form timestamp:body, computes an SHA-256 HMAC over that string with the signing secret, base64 encodes the digest, and sends it in the x-amzn-event-signature header alongside the same timestamp in x-amzn-event-timestamp. The colon matters. A signature computed over the two values joined any other way will not verify. The webhook documentation carries working samples in JavaScript and bash.
Put as much context as you can into the description field, because the agent starts from it. Naming the account, Region, and principal removes a round of discovery.
Test the path before you need it:
aws cloudwatch set-alarm-state \
  --alarm-name SecurityTriage-CreateAccessKey \
  --state-value ALARM \
  --state-reason "pipeline test"
A 200 means authentication passed and the event is queued, not that an investigation started. Events pass through the agent’s own triage step, which either schedules a new investigation, links the event to a recent related one, or skips it. Correlation looks back about 20 minutes, so firing the scenarios close together can attach later events to the first investigation. Unlink them in the web app to watch each separately.
Scope the agent role
The AIDevOpsAgentAccessPolicy managed policy is the default read-only set, and it is a subset of what the guardrail permits. The guardrail also allows every action in the ReadOnlyAccess AWS managed policy, plus athena:StartQueryExecution, athena:StopQueryExecution, and kms:Decrypt. To use anything beyond the default, attach it to the role as an inline policy.
One addition is required for the first scenario. S3 object reads are CloudTrail data events, and data events never appear in CloudTrail Event history or the LookupEvents API, which return management events only. To count what a principal read, the agent must read the delivered trail files in Amazon S3. Scope that to the trail prefix, and add kms:Decrypt if the bucket uses a KMS key.
{
  "Version": "2012-10-17",
  "Statement": [
    {
      "Sid": "ReadTrailObjects",
      "Effect": "Allow",
      "Action": "s3:GetObject",
      "Resource": "arn:aws:s3:::my-trail-bucket/AWSLogs/111122223333/CloudTrail/*"
    },
    {
      "Sid": "ListTrailPrefix",
      "Effect": "Allow",
      "Action": "s3:ListBucket",
      "Resource": "arn:aws:s3:::my-trail-bucket",
      "Condition": {
        "StringLike": { "s3:prefix": "AWSLogs/111122223333/CloudTrail/*" }
      }
    }
  ]
}
The guardrail also permits two Amazon Athena actions, used when a Logs Insights query times out and the agent falls back to logs in Amazon S3. That path does not arise in this lab, but it will against a production VPC shipping Flow Logs to Amazon S3, and it needs more than the two actions. Take the full set from the Athena documentation.
AWS has tested and verified only the managed policy permissions as safe for use with the agent. Anything beyond that falls under the shared responsibility model, so scope each addition tightly.
Investigate a compromised access key
The first script covers A01:2025, broken access control. Using the demo user credentials, it calls ListUsers and ListAttachedUserPolicies, calls CreateAccessKey, attempts AttachUserPolicy for AdministratorAccess, then reads objects from the customer-records/ prefix in bulk. The user has never created a key before, which is what makes one event worth alarming on. A metric filter on the CloudTrail log group drives the alarm:
{ ($.eventName = "CreateAccessKey") &&
  ($.userIdentity.userName = "sectriage-demo-user") }
When the investigation opens, steer it with a prompt:
An alarm fired for CreateAccessKey by sectriage-demo-user in account
111122223333.
Reconstruct every API call this principal made in the last hour from
CloudTrail,
in order, with the source IP and the result of each call. Tell me
which calls
succeeded, which were denied, and how many S3 objects the principal
read.
One timing caveat applies to all three scenarios. CloudTrail typically delivers events within about five minutes of the call, and delivery time is not guaranteed, so activity following the triggering event may still be in flight. If a sequence looks truncated, steer the investigation to query again a few minutes later rather than reading the gap as proof that nothing else happened.
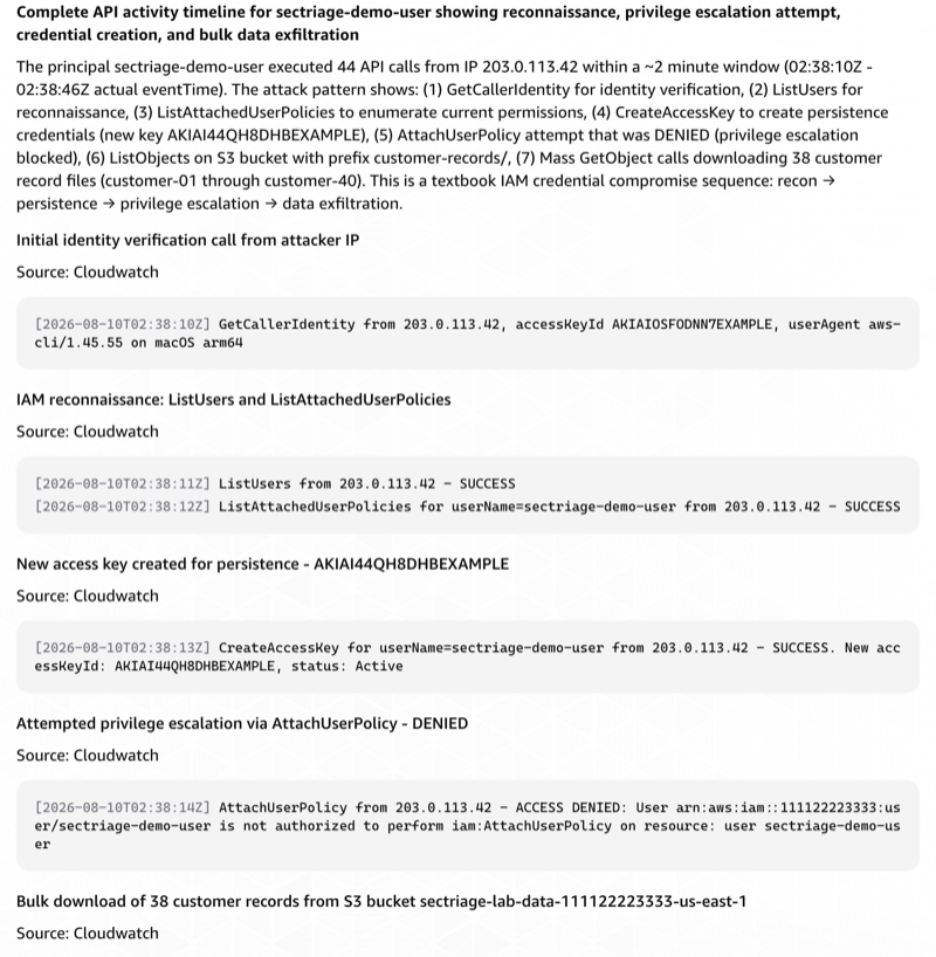
The agent returns the sequence rather than the single event that fired the alarm: reconnaissance, then the second access key, then the policy attach and its result, then the object reads with the prefixes they touched and the address behind them.
Figure 2 shows 44 calls inside 36 seconds. 43 succeeded and AttachUserPolicy was denied. Of the 43 successful calls, 38 were object reads from the customer-records/ prefix.
Read the result of each call, not just the call. Whether AttachUserPolicy succeeds or is denied is the difference between a contained problem and an active one. Denied means the principal still holds only its original permissions, but it read data and it has a second key. Deactivate both keys and check GuardDuty for findings against the principal.
Investigate a security group opened to the internet
The second script covers A02:2025, security misconfiguration. It calls AuthorizeSecurityGroupIngress to open port 22 to 0.0.0.0/0 on the lab security group. The filter matches that call only when the CIDR is open:
{ ($.eventName = "AuthorizeSecurityGroupIngress") &&
  ($.requestParameters.ipPermissions.items[0]
    .ipRanges.items[0].cidrIp = "0.0.0.0/0") }
This prompt separates exposure from exploitation:
A security group in account 111122223333 was opened to 0.0.0.0/0.
Identify the
principal, the time, and the source IP of the change. List every
resource
attached to that security group. Then check VPC Flow Logs for accepted
inbound
traffic on the affected port since the change, and tell me whether
anything
reached the instance.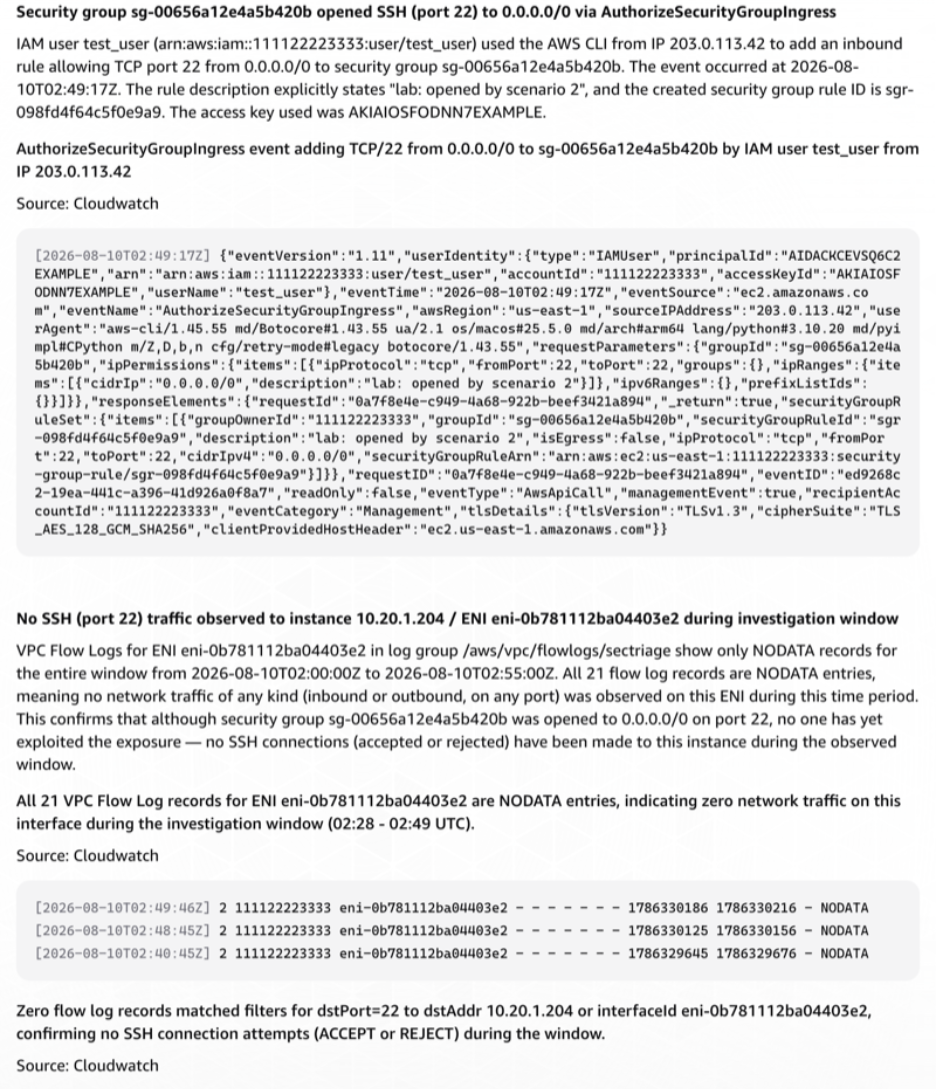
The agent reports who made the change and what the group is attached to, which most posture tools also do. Then it queries Flow Logs for accepted inbound records on the port after the change timestamp.
If no records match, the port is open and unused, which makes this a change management problem rather than a security one. Accepted records from an address outside your ranges mean someone reached the instance. Revert the rule either way, and treat the second case as unauthorized access until you can prove otherwise.
Figure 3 is the first case. Every Flow Log record for the attached interface comes back NODATA, so nothing reached the instance on any port. The exposure was real and the exploitation was not, and the agent said which was which.
Investigate a burst of API abuse
The third script sends a burst at the API Gateway endpoint: failed authentication attempts, SQL injection strings in query parameters, and path traversal attempts. The attack spans A05:2025, injection, and A07:2025, authentication failures. The triage finding is A09:2025.
The detection is deliberately blunt. The metric filter matches every rejected request rather than one category, and the alarm trips above 50 in five minutes:
{ $.event = "request_rejected" }So the alarm says the rejection rate jumped, not what kind of traffic caused it. The category split is for the investigation to establish. An alarm that named injection would hand the agent its own answer.
Ask the agent to characterize the traffic and to state plainly where the logs cannot answer:
More than 50 rejected requests hit the payments-api in five minutes.
Read the application log group and characterize the traffic: how many
requests,
over what window, from which source addresses, and what categories of
request.
Then tell me whether any request succeeded, and say so explicitly if
the logs
cannot answer that.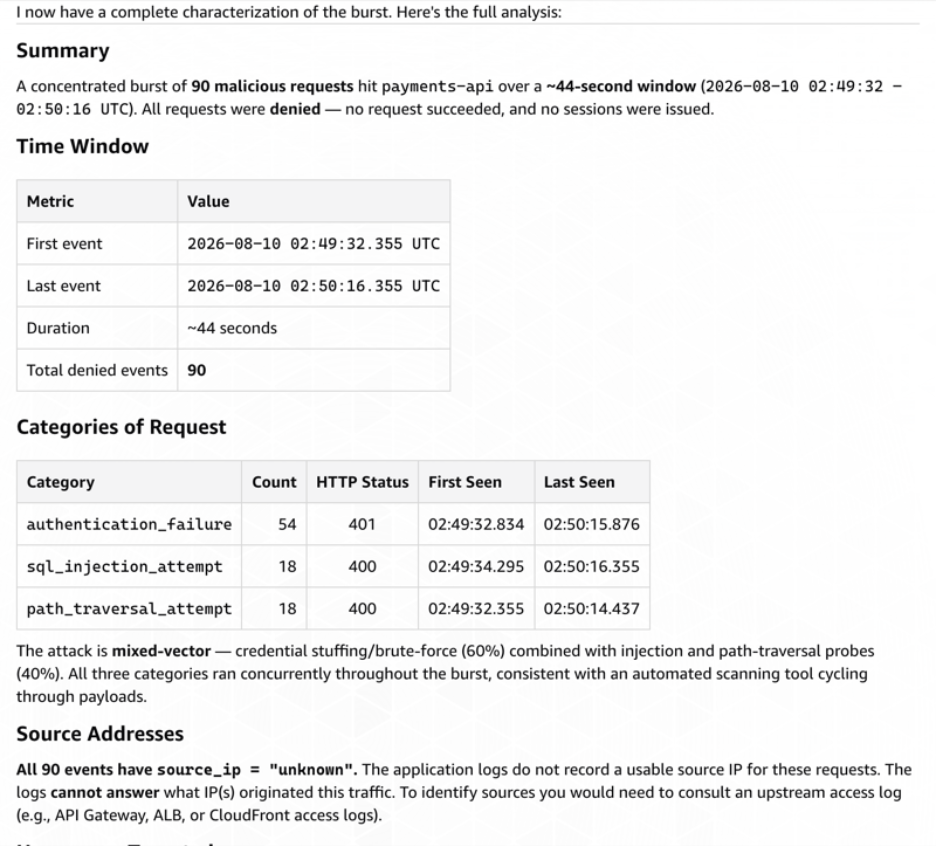
The agent characterizes the burst rather than listing log lines: request volume over a bounded window, the categories of request, and whether any of them got through. Figure 4 shows 90 requests across 44 seconds, split into 54 authentication failures, 18 injection attempts, and 18 path traversal attempts, with nothing succeeding and no session issued.
The field it could not fill in is the more useful half of the answer, and where A09:2025 comes in. Every record logged source_ip as unknown, so the agent said the logs cannot answer where the traffic came from and named the upstream access logs that could. A field that is present but always unknown is worse than a missing one, because it looks populated. The cause was one wrong field name in the logging code, and no correlation recovers that after the fact. Fix it before the next burst, not during.
Note what that costs you. The usual next step, blocking the offending address in AWS WAF, is not available here, because the application never recorded one. Pull the API Gateway access logs to recover the addresses, then block. If even one request returns 200, this stops being triage and becomes an incident.
Clean up resources
- Deactivate and delete both demo user access keys, including the one the first script created.
- Empty the lab S3 bucket, then delete the stack with
aws cloudformation delete-stack. Confirm the AWS Secrets Manager secret is gone afterward, since a retained secret keeps billing at $0.40 per month. - Turn off the CloudTrail S3 data event selectors for the lab bucket.
- Delete the webhook, or the whole Agent Space if you created it only for this lab.
- Delete the log groups the lab created, since they persist after the stack is gone.
From triage to response
Read the investigation for the difference between what the agent verified and what it inferred. The timeline shows every tool call it made, so a finding from a completed Logs Insights query is more reliable than one from a query that timed out.
After root cause, mitigation proposals appear inline in the investigation view. Each describes an action, its expected outcome, and its prerequisites, and you can refine it before choosing whether to apply it. Nothing is applied until you apply it, and the guardrail means the agent cannot call write actions against your resources through the role you gave it, whatever a proposal recommends.
For security findings, do not apply from the investigation view at all. Deactivating a key or reverting a rule during a live incident can destroy evidence or tip off whoever holds the credential. Treat the proposal as a drafted runbook step for the people who own that decision.
| What triage found | Where it goes next |
|---|---|
| Credentials used successfully, data read | Incident response team, plus a Security Incident Response case |
| Exposure with no matching traffic in Flow Logs | Change management, and a Security Hub control to catch the next one |
| Attack traffic, nothing succeeded | AWS WAF rule and continued monitoring |
| Logs cannot answer whether it succeeded | Fix the logging gap, and escalate on the assumption that it did |
Conclusion
This post shows how to route security-relevant CloudWatch alarms into AWS DevOps Agent, and how the agent answers the four questions that decide severity: who acted, what changed, what is exposed, and whether anything used it. The responder starts with assembled evidence.
Detection, posture, and case management stay where they already are. AWS DevOps Agent shortens the gap between an alarm firing and a responder knowing what they are looking at, and the guardrail keeps it read only.
Deploy the lab, then point the same pipeline at one real alarm you already get paged for and compare what the agent returns against what you gather by hand today. To review what the agent can reach in your account, see Limiting Agent Access in an AWS Account. If you want help applying this to your environment, contact your AWS account team.
GitHub Repo: https://github.com/aws-samples/sample-devops-agent-security-triage