Containers
Fix pod distribution drift in Amazon EKS with the Kubernetes descheduler
A workload spread across three Availability Zones (AZs) does not necessarily stay spread. In a measured run on an Amazon Elastic Kubernetes Service (Amazon EKS) cluster, we watched a balanced 1,000-pod fleet concentrate into only two zones after a brief node-availability gap, while the third zone dropped to zero pods. After capacity returned, the imbalance held for over 16 hours with every node healthy and schedulable.
Nothing malfunctioned. Every component behaved as designed. That is precisely why this pattern deserves attention: the drift is silent, it does not self-correct for stable workloads, and the manifests still describe a distribution that the running state no longer matches.
In this post, we explain why drift happens under soft topology spread constraints, measure what it costs, and demonstrate how the Kubernetes descheduler restores the distribution your constraints describe. The second half is a hands-on walkthrough you can reproduce on Amazon EKS: you scale a workload under randomized load, simulate a disruption, confirm the scheduler does not repair the skew on its own, and then watch the descheduler restore balance. Every number in this post comes from that measured run, and the manifests, dashboards, and scripts to reproduce it are in the accompanying repository sample-eks-descheduler-drift-demo.
Background
Kubernetes places pods with the default kube-scheduler, a component of the Kubernetes control plane. When you give a workload topologySpreadConstraints, the scheduler evaluates them at admission (when the pod is first placed) as part of its scoring algorithm, which ranks candidate nodes by fit.
This is the one fact that explains everything else in this post, so we state it once with emphasis: the scheduler evaluates topology spread only at pod creation time. It does not revisit running pods. Once a pod is placed, its position is fixed for the life of that pod.
Three fields govern a topology spread constraint:
- topologyKey: the node label defining a domain. For AZ spreading this is
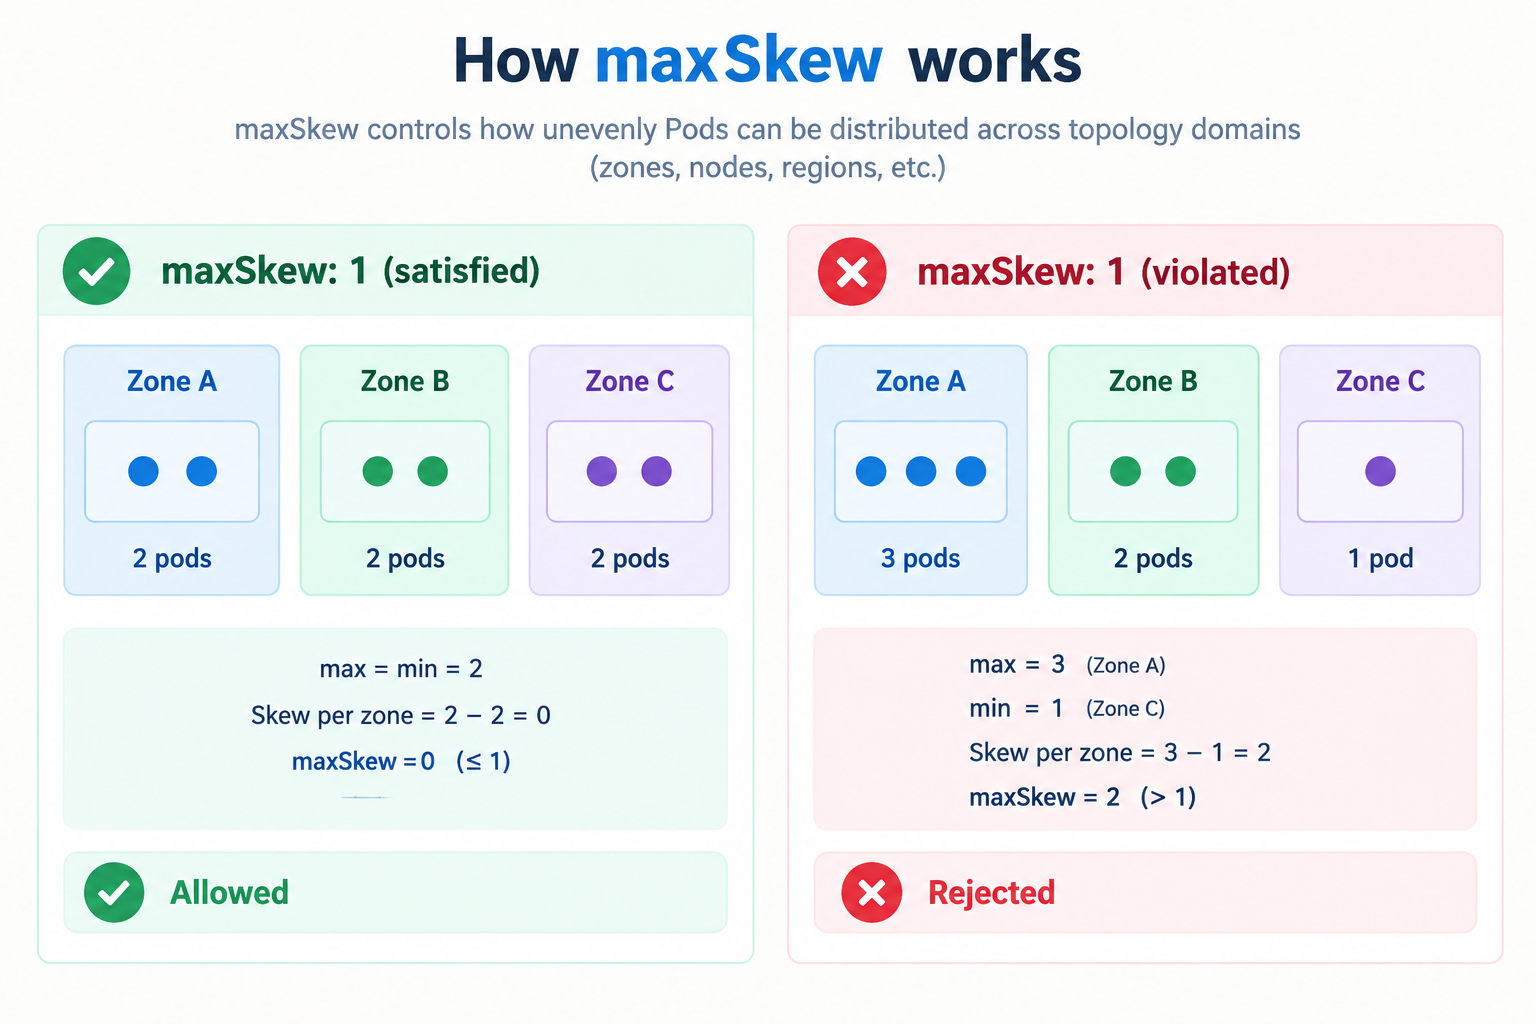
topology.kubernetes.io/zone. - maxSkew: the maximum allowed difference in matching pod count between the busiest and least-busy domain.
- whenUnsatisfiable: what the scheduler does when a placement exceeds maxSkew. This is where soft and hard diverge.
Example topology spread constraint:
The whenUnsatisfiable field has two options:
ScheduleAnyway(a soft constraint) treats spread as a scoring preference. If the preferred zone cannot accept a pod at that moment, the pod is placed in a zone that can. The workload stays available. The distribution absorbs the imbalance.DoNotSchedule(a hard constraint) treats spread as a filter. A pod that cannot be placed within maxSkew stays Pending.
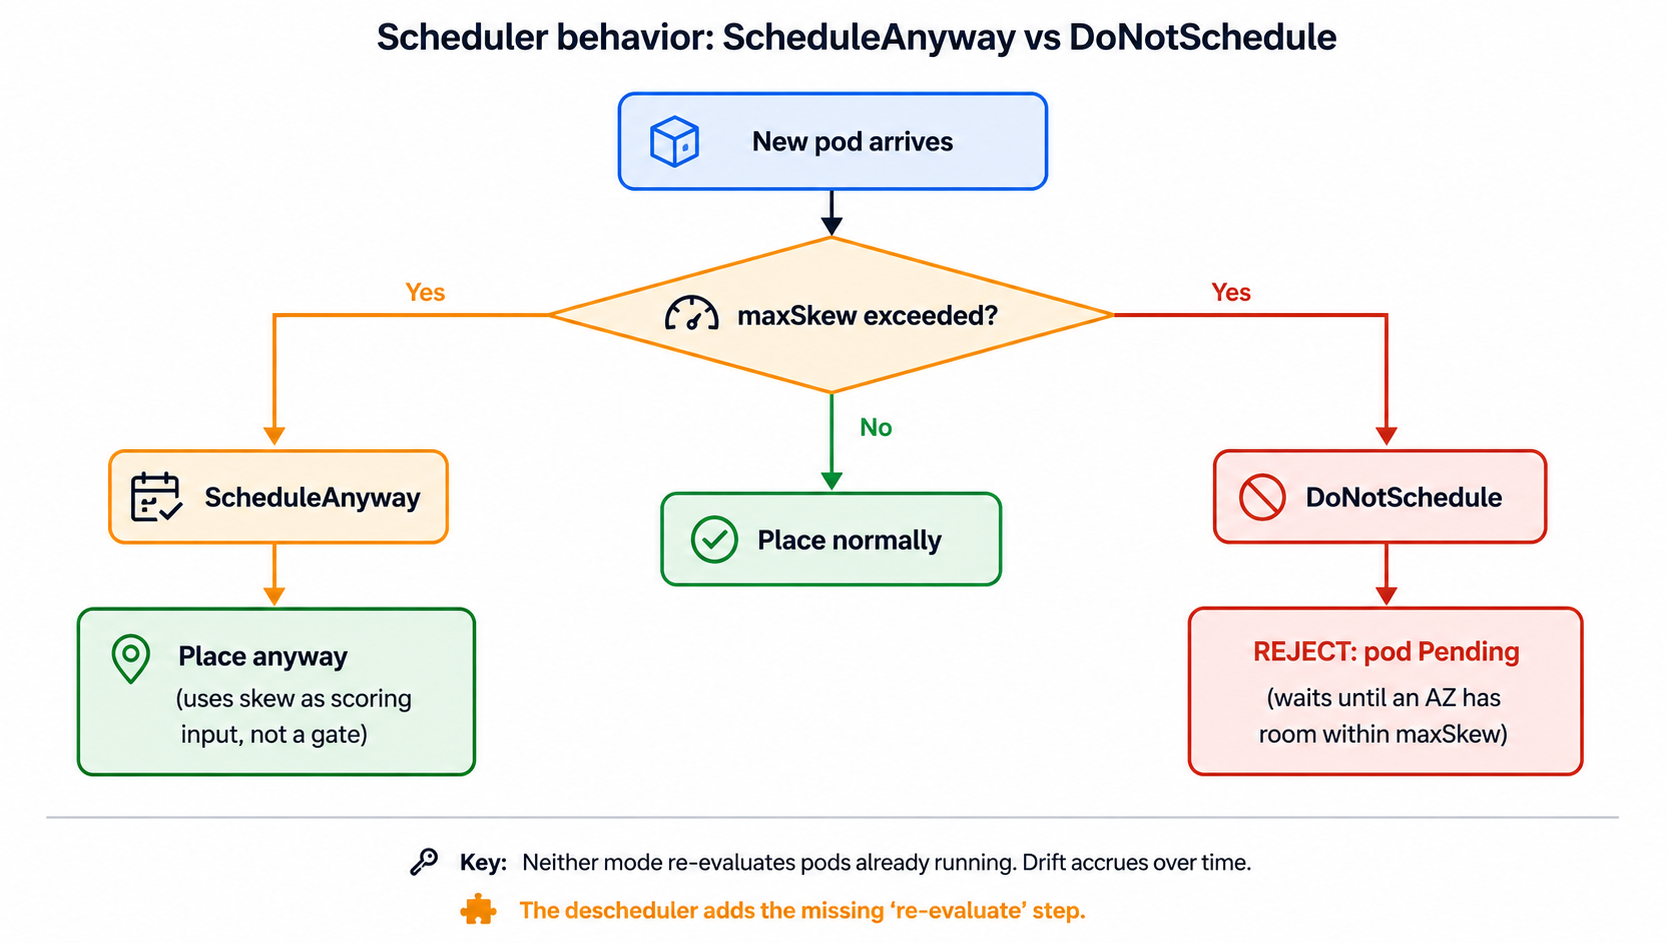
Rebalancing running pods is intentionally not part of core Kubernetes. Moving a pod means terminating it and scheduling a replacement, and whether that trade is worth making depends on the workload. Kubernetes keeps placement and post-placement policy separate, and provides the descheduler, a Kubernetes SIG project, as the opt-in tool for the second half.
The core problem: drift
Drift has two ingredients: pod churn and a reason the scheduler cannot honor the preference. Both are routine.
Churn comes from autoscaling. In our run, three Deployments (web-frontend at 500 maxReplicas, web-api at 300, web-orders at 200) were driven by Horizontal Pod Autoscalers (HPAs) chasing randomized HTTP load. Over a 35-minute baseline with all zones schedulable, the fleet oscillated between roughly 300 and 717 pods, and skew spiked as high as 45 during rapid scale-ups before returning under maxSkew each time. Scale-down produces the same effect in reverse: during a later descent, skew transiently reached 82 because replicas are removed unevenly too. Under healthy conditions, churn both causes and corrects drift.
The scheduler cannot honor the preference when a zone has no schedulable capacity. Many ordinary operations produce that condition: a managed node group upgrade, Karpenter consolidation, an Auto Scaling group replacing an instance, a Spot Instance interruption, a cordon during maintenance (cordon marks a node unschedulable. Drain additionally evicts its pods), or an InsufficientInstanceCapacity response during a scale-up. All of these result in nodes becoming unschedulable (the node.spec.unschedulable API field marks a node off-limits for new pods) or being removed entirely.
Combine the two and the drift becomes severe. We reproduced one of the conditions that causes it by cordoning all seven nodes in one AZ and deleting the demo pods on them, which is what an instance-level disruption does to a workload:
Initial snapshot:
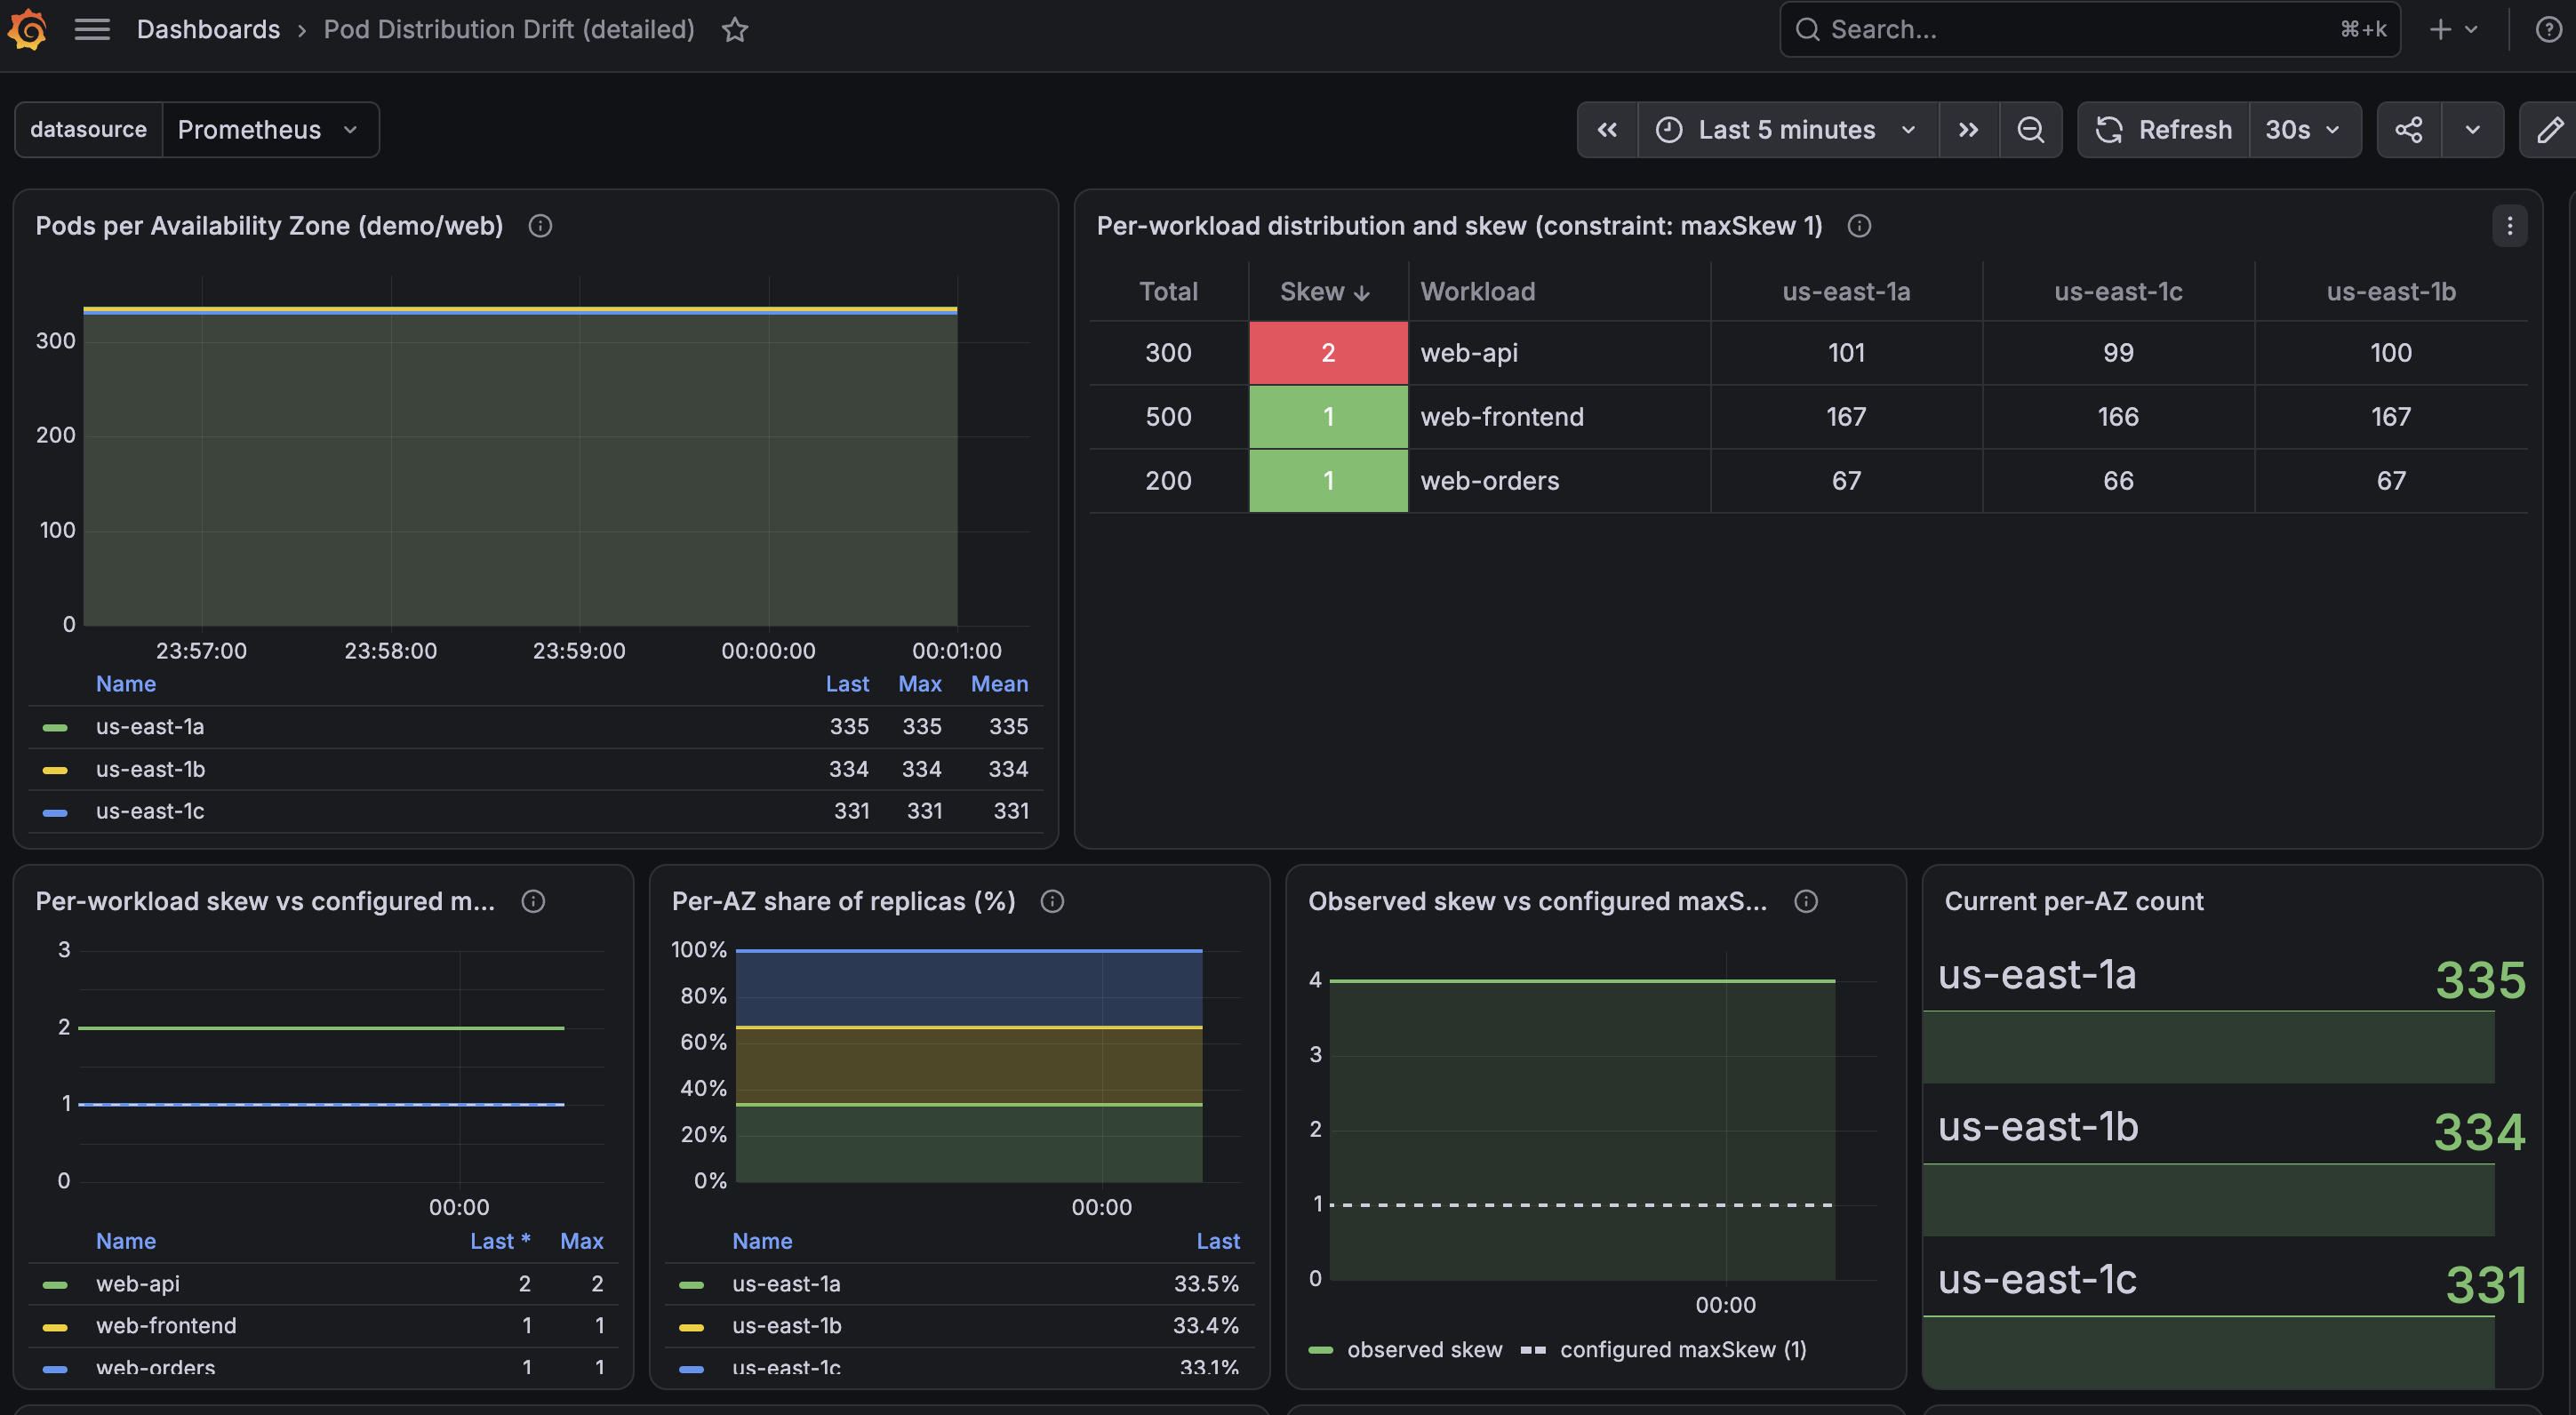
The fleet reorganized to 500/500/0 in about 90 seconds. All 1,000 pods kept running: unready stayed at 0 and pending touched 1 for a single 30-second sample. Availability was preserved, which is exactly what the soft constraint is for, and exactly why the drift produces no alarms.
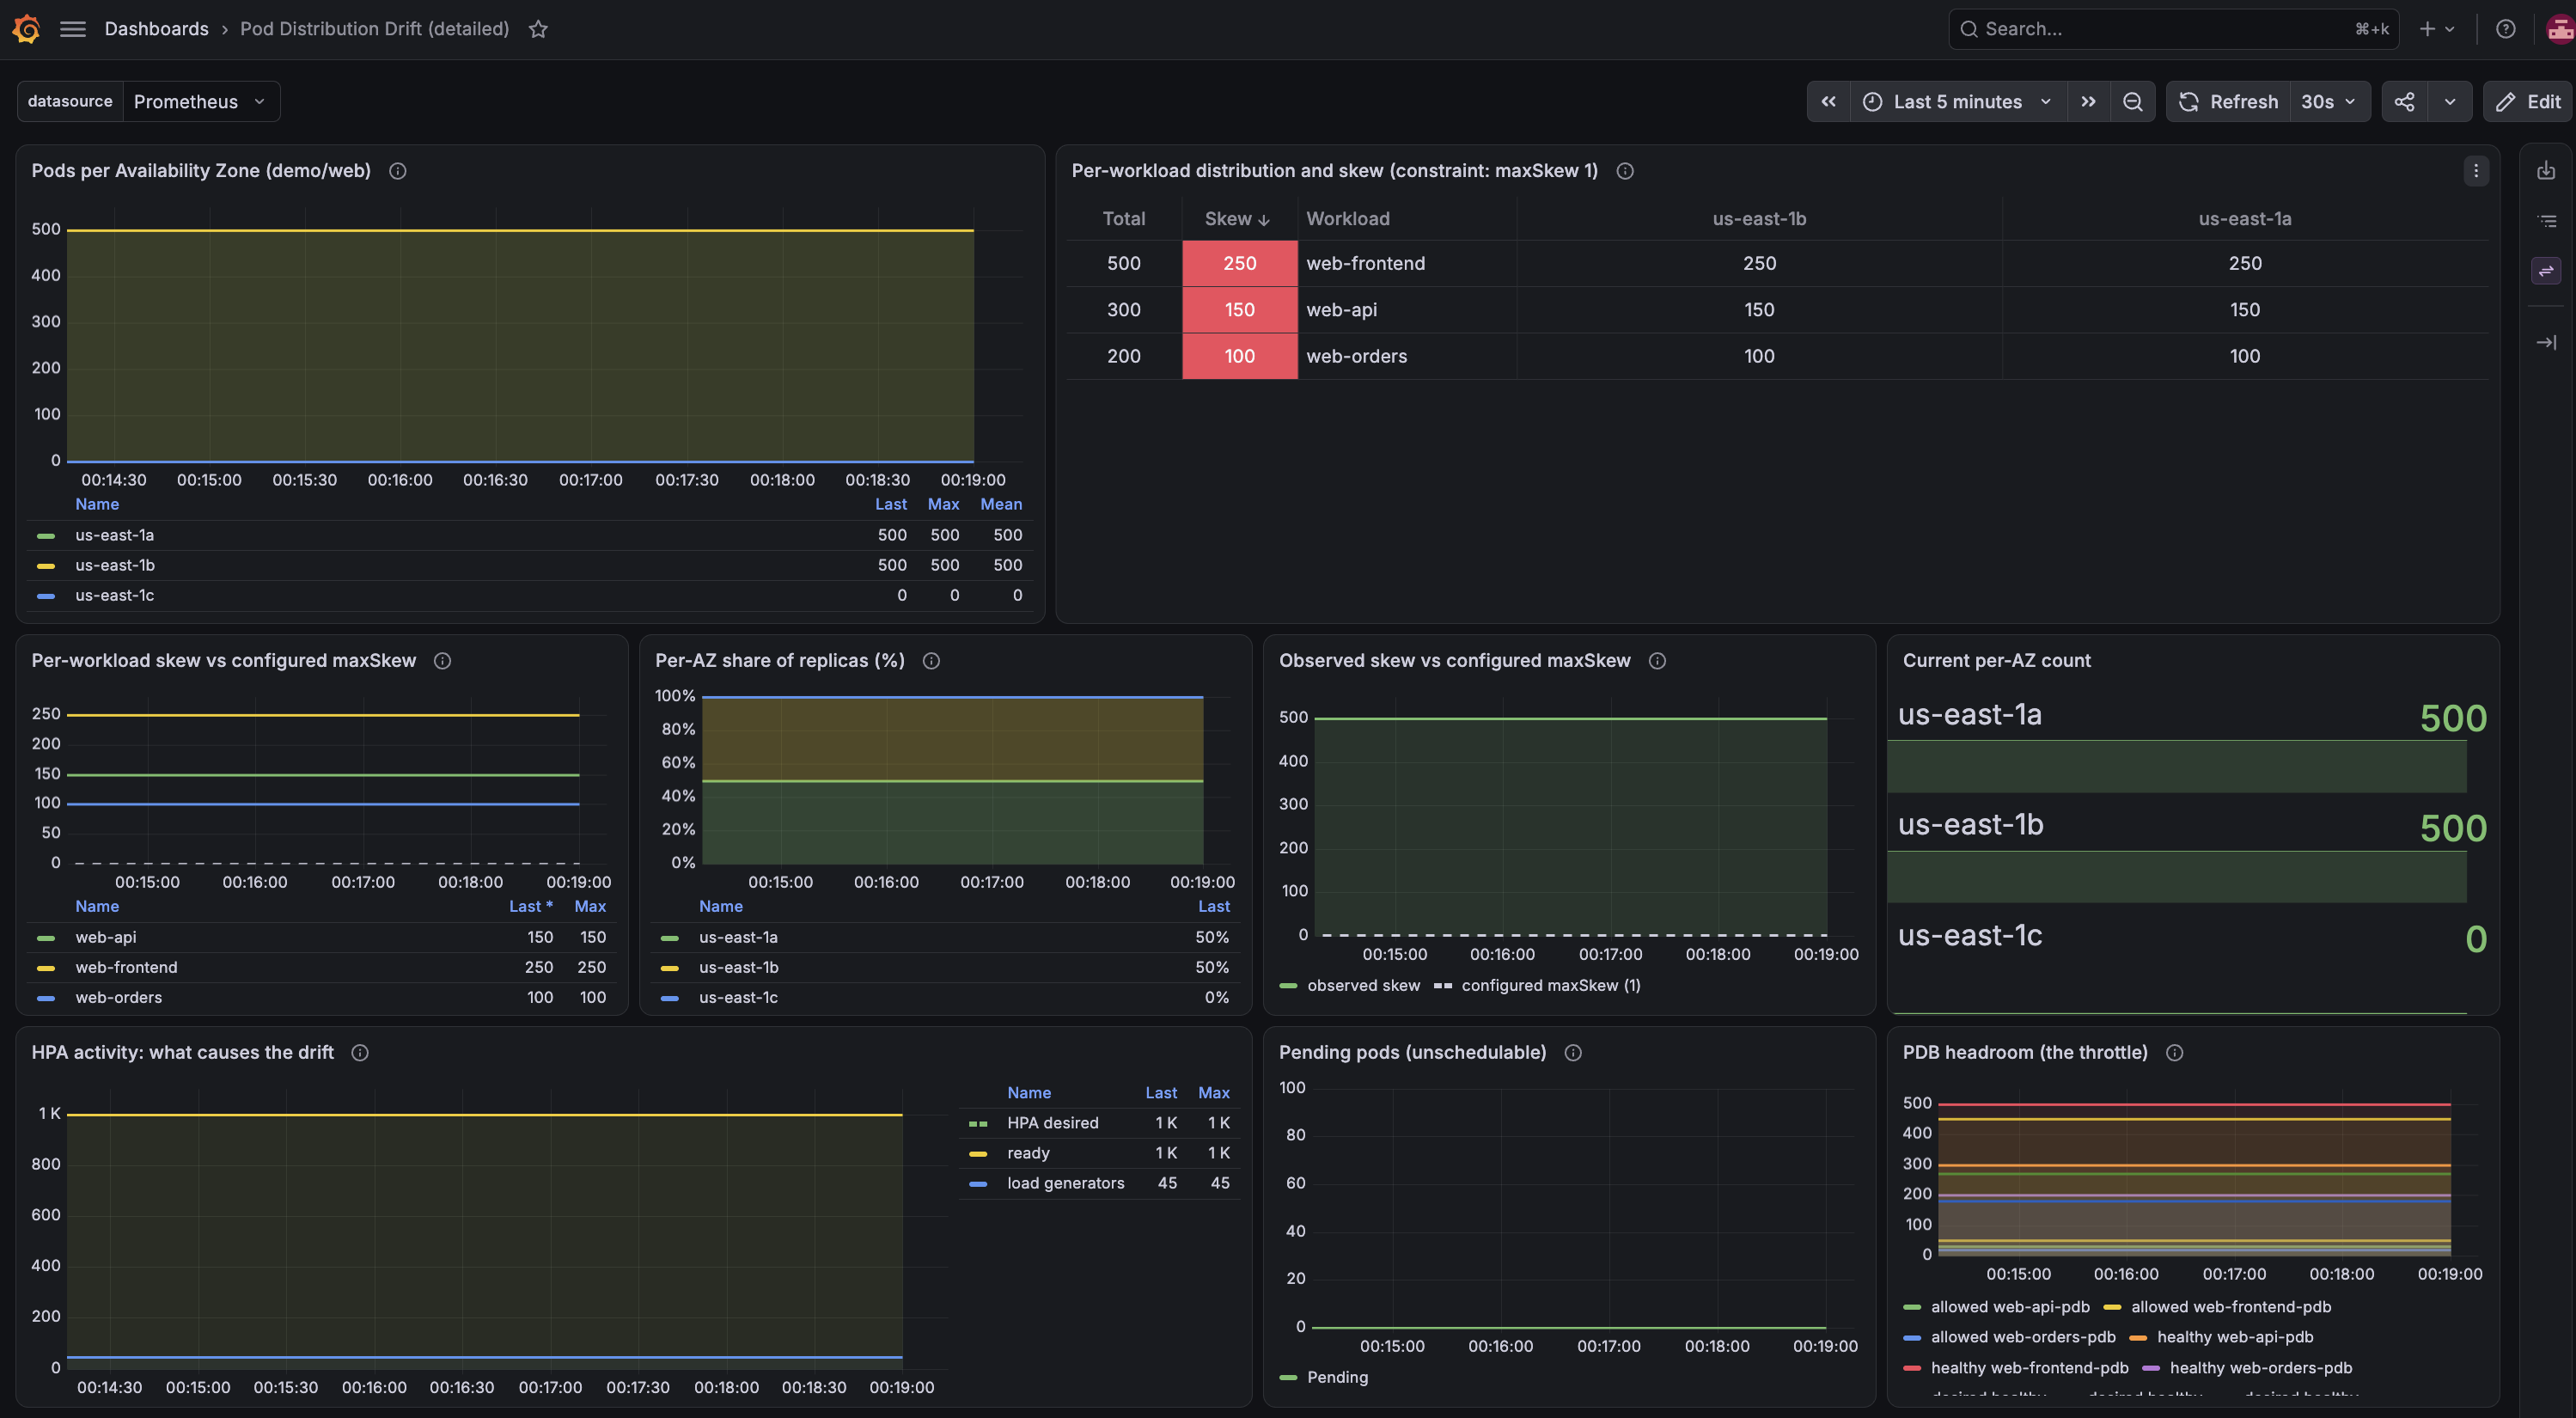
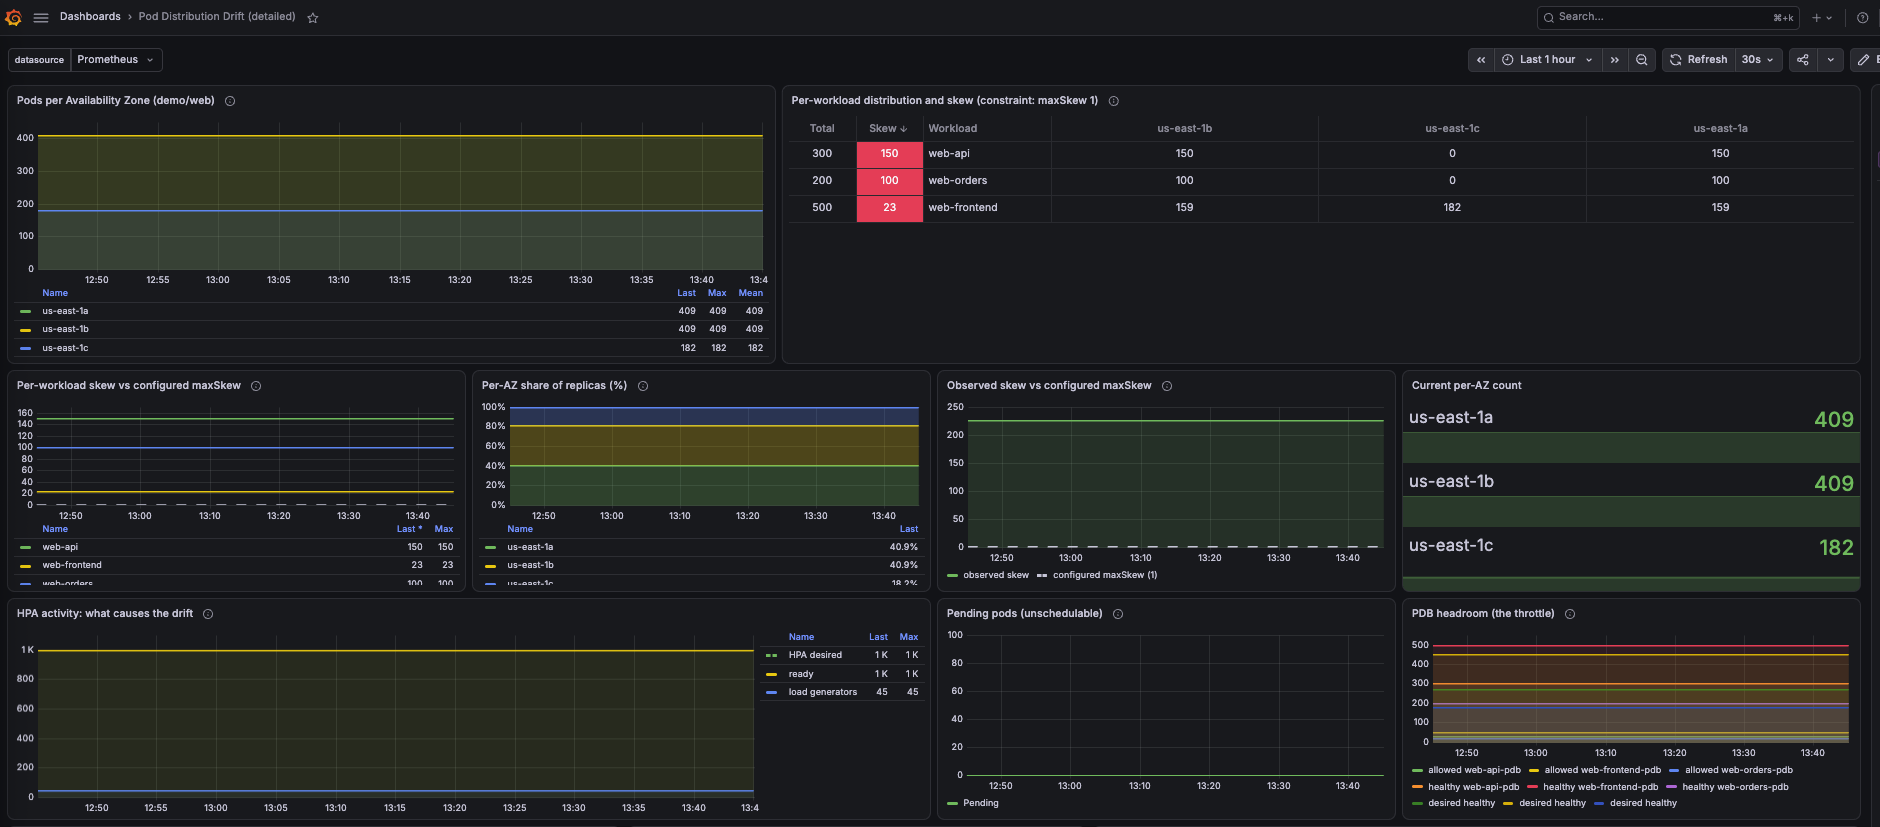
Then we restored capacity and did nothing. For 97 minutes the distribution held at exactly 500/500/0. What happened next is the most instructive data in the run. The HPAs happened to scale down and back up, and the data revealed the qualification that matters: new pods can land in the underloaded zone. Running pods are not redistributed. web-frontend, whose HPA was oscillating, went from skew 250 to roughly 23 as its new pods landed in the recovered zone. web-api and web-orders were pinned at their maxReplicas limit, created no new pods, and stayed at skew 150 and 100 with zero pods in the recovered zone. The fleet then held skew 227 for 16 hours and 45 minutes with full capacity available.
Drift ratchets for stable workloads: each placement made during the gap persists. Workloads that churn recover incidentally. Workloads at steady state, which in many production clusters is most of them, stay skewed indefinitely.
The primary cost is resilience: a workload with half its pods in each of two zones and none in the third is less resilient to any single-zone disruption than its spec implies. Secondary consequences accumulate quietly:
- Cross-AZ data transfer charges, billed in both directions, for traffic that would have stayed zone-local.
- Subnet IP pressure concentrating in the surviving zones.
- Uneven node utilization, which distorts autoscaling signals and right-sizing decisions.
Hard constraints: a different tradeoff
If soft constraints permit drift, why not use DoNotSchedule and prevent it outright? For some workloads, you should. It is a valid design choice with a different failure mode, not a wrong answer.
| . | Soft (ScheduleAnyway) | Hard (DoNotSchedule) | Soft + descheduler |
| Existing pods disrupted? | Never | Never | Yes, controlled by PDBs (PodDisruptionBudgets, which cap how many pods can be unavailable at once) |
| New pods during a gap | Placed in surviving zones | Stay Pending | Placed in surviving zones |
| Long-term balance | Drifts. Corrects only via churn | Always within maxSkew | Restored after each gap |
| Workload requirement | None | Tolerates reduced capacity | Tolerates restarts |
| What to monitor | Per-AZ counts and skew | Pending pods, FailedScheduling | Skew, evictions, PDB headroom |
Hard constraints convert silent skew into visible pending pods. During our simulated gap, a hard-constrained fleet would have refused to scale into the surviving zones: replicas beyond maxSkew would have queued until the zone returned. If zone balance is a correctness requirement, that is the right trade, and you should alarm on pending pod count and scheduling failures so the trade stays visible.
For workloads where serving traffic matters more than exact placement, soft constraints are the right base, and the question becomes how to correct the drift they permit. That is the descheduler’s job.
The solution: the descheduler
The Kubernetes descheduler runs on a periodic loop. It is not an admission controller and it does not place pods. It evaluates the running state of the cluster against a policy, evicts pods that violate the policy (an eviction is a controlled pod termination that triggers rescheduling), and relies on the kube-scheduler to place the replacements. Because it uses the Eviction API, PodDisruptionBudgets apply (a PDB is a rule capping how many pods of a workload may be unavailable at once).
For drift, the relevant plugin is RemovePodsViolatingTopologySpreadConstraint. By default it acts only on hard constraints. Listing ScheduleAnyway in its constraints makes it act on soft constraints, which is the configuration most workloads actually run.
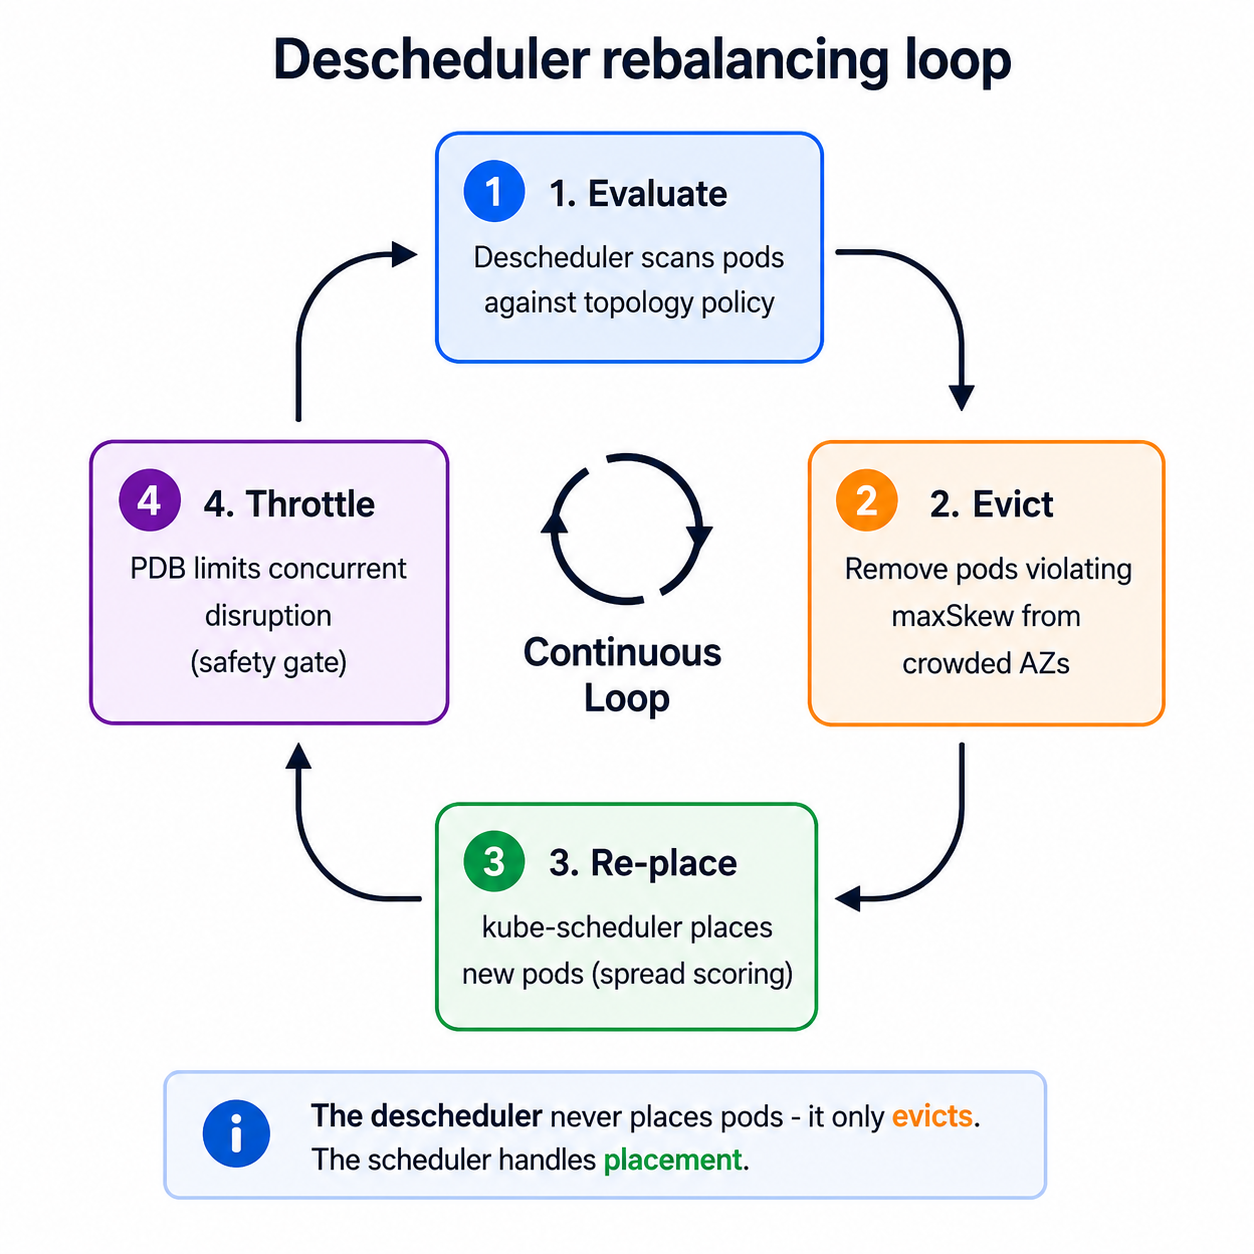
Two settings do the safety work, and we measured both:
topologyBalanceNodeFit: true prevents evictions when no better placement exists. We ran one descheduler pass while the affected zone was still cordoned. It skipped 100 web-api pods and 67 web-orders pods, logging “ignoring pod for eviction as it does not fit on any other node” for each. Those counts equal the full correction each Deployment needed: the descheduler declined every eviction whose only viable destination was the cordoned zone because the only zone that could receive the pods was unschedulable.
PDB enforcement. The descheduler will not evict a pod if doing so would violate the budget. Our PDBs (maxUnavailable: 10%) allow 50, 30, and 20 concurrent disruptions for the three Deployments. The PDB caps concurrent disruption, ensuring a minimum number of pods stay available throughout the rebalance. maxNoOfPodsToEvictPerNamespace caps total evictions per run. They answer different questions, and the descheduler honors both.
The correction, measured
With all zones schedulable again, we ran the descheduler with the CronJob suspended so each pass could be counted independently. Before the first pass, we computed the theoretical minimum number of moves from the target distributions: roughly 180.
| Pass | Evicted | web-frontend | web-api | web-orders | Result |
| During gap (cordoned) | 225 | 225 | 0 | 0 | frontend reaches target |
| 1 | 162 | 15 | 91 | 56 | 345/340/315 |
| 2 | 21 | 1 | 9 | 11 | 333/334/333, skew 1 |
| 3 (verification) | 0 | – | – | – | steady |
| Total | 183 | 16 | 100 | 67 | skew 1 |
183 evictions against a predicted minimum of about 180. The descheduler did the minimum work the constraint required. All 162 pass-1 evictions completed within a single run despite the 50/30/20 concurrency budgets, because eviction is sequential, and PDB headroom recovers as replacements become Ready: the PDB throttled the rate, not the total.
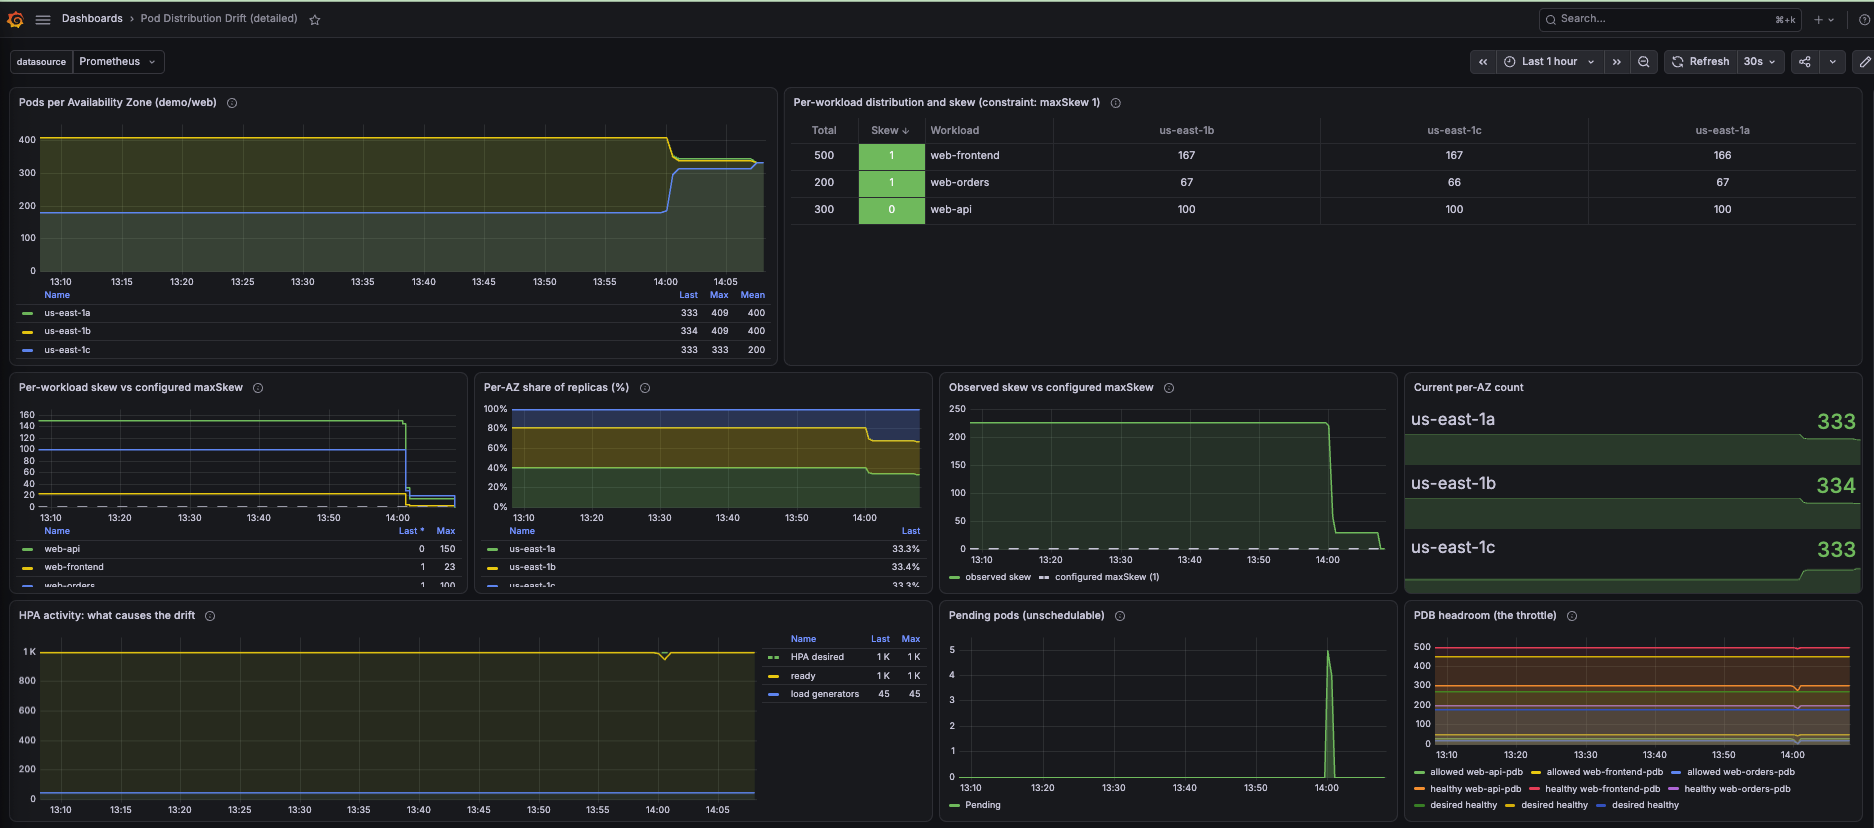
Availability cost: unready stayed at 0 at every 30-second sample throughout. Prometheus, sampling more finely, caught 5 pending pods (0.5 percent of the fleet) for less than one scrape interval during the 162-eviction pass.
Two caveats keep that number honest. Our image (the hpa-example image from the Kubernetes HPA walkthrough) starts fast. An application that warms a cache, synchronizes state, or replays a log will hold a wider unready window for the same eviction volume, so scale eviction caps down and PDB budgets up accordingly. And headroom matters: the same experiment on a 3-node cluster produced a proportionally larger pending spike, because a denser cluster has less room to place replacements.
Evictions are still disruptive. Every corrected pod is a pod restart. Long-lived connections are broken and re-established, caches start cold, and slow readiness probes stretch the reduced-capacity window. PDBs limit concurrency. They do not eliminate disruption. Weigh the resilience gained against the restarts spent.
| Phase | us-east-1a | us-east-1b | us-east-1c | Skew (per app) | What happened |
| Baseline at max load | 335 | 334 | 331 | 2 | Symmetric capacity, HPAs at maxReplicas (skew measured per-Deployment) |
| Churn baseline | varies | varies | varies | varies (for example, 0 to 45) | Transient, self-correcting |
| Node-availability gap in 1c | 500 | 500 | 0 | 500 | Replacements placed in surviving zones |
| Capacity restored, stable | 409 | 409 | 182 | 227 | Held 16h 45m. Only churning workload recovered |
| After the descheduler | 334 | 333 | 333 | 1 | Converged to the configured maxSkew |
Should you use the descheduler?
Work through four questions before enabling it:
- Are the workloads stateless and restartable? If not, prefer hard constraints or accept the skew. See also the following exclusions.
- Is observed skew a meaningful fraction of the fleet under sustained load? Transient spikes during scaling self-correct. Our churn baseline hit skew 45 and recovered without help. Sustained skew after a gap is what needs intervention.
- Is the skew actually costing you in resilience posture, inter-AZ transfer, or IP pressure? If not, monitoring may be enough.
- Can the workload tolerate PDB-controlled restarts? If not, tighten the PDB and exclude sensitive namespaces first.
When not to use it. Skip descheduling for Kafka consumers mid-partition-assignment, batch or ML training jobs near a checkpoint, workloads intentionally co-located (publish/subscribe groups, pods pinned to a zone by Amazon Elastic Block Store (Amazon EBS) volumes, same-AZ microservice pairs kept close for latency), and low-load clusters where the skew is small. That last case has a measured arithmetic behind it: when our HPAs idled the fleet down to minReplicas of 2 per Deployment, the six remaining pods sat at 2/4/0. With 2 replicas across 3 zones, one zone is necessarily empty and skew 1 is the floor. A descheduler pass correctly skipped two Deployments as already balanced and evicted one of web-api’s two pods (half that workload restarted) to move its skew from 2 to 1, a result that can never reach zero. The percentage PDB permitted it, because Kubernetes rounds maxUnavailable: 10% up to 1 on a 2-replica Deployment. Use absolute PDB values for small Deployments, and consider excluding them from descheduling entirely.
Walkthrough
Measured on Amazon EKS 1.36 with descheduler Helm chart 0.36.0, on 21 m5.2xlarge nodes (7 per AZ). At On-Demand pricing the node group costs approximately $8 per hour at the time of writing. Plan to complete the walkthrough in a single session and delete the node group promptly. You do not need this scale to see the behavior: the repository includes a 100-pod, 3-node variant that reproduced every finding (drift to 50/50/0, no self-correction for 2 hours 45 minutes, correction in 23 evictions, exactly the theoretical minimum, converging to 33/34/33).
The full manifests are in the accompanying repository (sample-eks-descheduler-drift-demo). The blog highlights the key configuration decisions. Check your cluster’s actual AZs before starting (aws eks describe-cluster and the subnet list). The repository defaults assume three zones and the scripts take zone names as parameters.
Applying manifests directly from the repository. Set the raw base once. Every kubectl/helm step applies straight from this repo:
The repository must be public (or the URLs otherwise reachable without authentication) for direct kubectl apply -f "$RAW/..." to work. kubectl does not send credentials when fetching manifests over HTTPS. For a private repo, clone it and apply from the local paths instead.
Set your cluster variables once; every command below references them:
1. Capacity
Enable VPC CNI prefix delegation before creating the node group, so managed node groups auto-calculate max pods to 110 for m5.2xlarge (prefix delegation assigns /28 prefixes. The subnets need sufficient contiguous IP space):
Create the node group with your tool of choice (console, Terraform, CDK, eksctl, or the AWS CLI. The repository documents the requirements). Before proceeding, verify that nodes are evenly spread across zones (7/7/7) and that each node shows 110 allocatable pods.
See Amazon EKS node IAM role for the full trust policy and creation steps.
2. Monitoring
We used kube-prometheus-stack for per-pod granularity and custom PromQL. Amazon CloudWatch Container Insights is a managed alternative.
Three important notes from our testing:
- kube-state-metrics (which exposes Kubernetes object state as Prometheus metrics) does not export zone labels by default. Extend its
metric-labels-allowlistwithtopology.kubernetes.io/zoneor every per-AZ query returns empty. - Size Prometheus for the fleet. The chart’s default memory limit is 2Gi, and an earlier run of this experiment lost its metrics history to an OOMKilled Prometheus (exit code 137) at exactly that limit. We run 10Gi.
- A zone with zero pods produces no series at all, so a plain max() – min() over per-zone counts silently understates skew at the worst moment. When our zone emptied, the naive query read 0 while actual skew was 500. To handle this, insert a zero for every zone that has nodes but no matching pods: sum by (zone) (pod_counts) or count by (zone) (kube_node_labels) * 0.
Do not chart descheduler_pods_evicted_total in CronJob mode: the pod lives a few seconds per run, shorter than a scrape interval, so the counter is never collected and the panel reads 0 forever. Count evictions from Job logs or events, or run the descheduler as a Deployment if you need live metrics.
3. The workload fleet
The walkthrough uses three Deployments (web-frontend, web-api, and web-orders) to mirror a realistic multi-service cluster. The descheduler evaluates topology violations per workload, so using multiple Deployments lets us observe how each one behaves differently during and after a disruption.
The key configuration in each Deployment’s pod spec:
Each Deployment also has an HPA (CPU 50%), a PodDisruptionBudget (maxUnavailable: 10%) that throttles the descheduler’s evictions, and a load generator that uses wget to send randomized HTTP bursts.
4. Simulate the node-availability gap
We used kubectl drain on the zone’s nodes (drain cordons the node and evicts its pods) for simplicity and portability to mirror what instance loss does.
AWS Fault Injection Service (AWS FIS) is the more realistic alternative and the repository includes an experiment template, with one measured caveat: against a managed node group, aws:ec2:stop-instances does not hold the zone out for the configured duration, because the Auto Scaling group replaces the stopped instance within minutes.
For a controlled window, cordon/drain is the more reliable instrument.
You should see a skew greater than 1 now and the displaced pods have been placed across the other two zones.

Now uncordon 1c:
Wait 5–10 minutes, and watch Grafana. Nothing has changed. The us-east-1c zone stays at 0 even though the nodes are healthy again. Kubernetes does not move running pods to fix a soft spread constraint.
5. Install and run the descheduler
Install the descheduler Helm chart with the CronJob initially suspended, so you can trigger and measure each pass manually:
To measure a pass cleanly, suspend the CronJob first, then trigger a manual run.
The following policy is the complete descheduler-values.yaml used in the run (this block is the whole file, not an excerpt):
The Helm chart sets priorityClassName: system-cluster-critical on the descheduler pod by default, so the CronJob pod scheduleds ahead of lower-priority workloads even during a capacity crunch. The chart installs to kube-system by convention.
Count evictions from the job log (totalEvicted) or from events. On a large cluster, filter events rather than listing them all:
A single pass will not fully fix the skew. The PodDisruptionBudgets cap how many pods can be evicted at a time, so each run moves only a limited number:
Those are not errors. They are the PDBs doing their job.
So trigger another pass, and keep going until the skew is gone:
Watch the per-workload skew panel in Grafana step down with each run. Ours took two passes plus a verification pass to reach a skew of 1 per workload, with Pending pods flat at zero at every 30-second sample.
In production you would not do this by hand. Unsuspend the CronJob and let the schedule converge on its own:
Cleaning up
To avoid ongoing charges, remove the resources you created:
- Stop the workload first:
- Remove the tooling:
- Remove the nodes (the dominant cost):
If the cluster was created solely for this demo, delete it once the node group is gone:
Operating the descheduler long term
Scope narrowly, then expand. Start with one namespace whose workloads tolerate restarts. Graduate to broader scope after 48 to 72 clean hours. The repository includes pilot and production policies for this progression.
Put a PDB on every workload in scope before enabling anything. This is the control that makes eviction safe. As noted earlier, percentages round up on small Deployments. Use absolute values below roughly ten replicas.
Choose maxNoOfPodsToEvictPerNamespace deliberately. Start at 10 to 20 percent of the namespace’s pod count (we used 200 for a 1,000-pod namespace), then tune by convergence speed and PDB headroom. Lower it for slow-starting workloads.
Match the schedule to the workload. The 2-minute schedule makes demo convergence watchable. Production intervals of 15 minutes or longer are more appropriate. Every run is an opportunity to evict.
Gate on load, not just time. Scheduling the descheduler for quiet hours sounds safe, but quiet hours are when autoscaled fleets sit at minReplicas, where skew has an arithmetic floor and percentage PDBs are at their weakest. As measured earlier, the correction available at that point can cost half a small workload and still not reach balance.
Watch per-workload skew, not just the aggregate. During the cordoned-zone pass, correcting web-frontend temporarily increased fleet-level skew while reducing frontend’s own. Per-deployment skew is what the descheduler acts on. The aggregate can move the other way and mislead you.
Do not run the topology plugin alongside LowNodeUtilization at first. One spreads pods across zones, the other consolidates them onto fewer nodes, and together they can oscillate. Start with just the topology plugin. Add utilization-based plugins only after you have confidence in PDB coverage and have observed stable convergence.
Pause during maintenance. Suspend the CronJob during planned capacity drains or cluster upgrades to avoid conflicting evictions.
Conclusion
Topology spread constraints describe intent at scheduling time. As noted at the start, nothing in core Kubernetes revisits that intent for running pods. Under routine churn the distribution takes care of itself. After a node-availability gap, the stable part of your fleet keeps whatever shape the gap gave it: in our measurement, skew 227 across 1,000 pods, unchanged for 16 hours and 45 minutes with full capacity available, until the descheduler restored the configured spread in 183 evictions (within a handful of the theoretical minimum) with zero unready pods at every 30-second sample.
The descheduler is a sharp tool with real trade-offs: every correction is a restart, and the operating guidance above (PDBs first, narrow scope, deliberate eviction caps, absolute budgets for small Deployments) is what keeps those restarts safe. Whether you adopt it, choose hard constraints, or decide your skew is affordable, make the choice deliberately, and monitor the failure mode of the option you picked.
References
- Accompanying repository with all manifests, dashboards, and capture scripts: https://github.com/aws-samples/sample-eks-descheduler-drift-demo
- Kubernetes descheduler Helm chart: https://github.com/kubernetes-sigs/descheduler/tree/master/charts/descheduler
- RemovePodsViolatingTopologySpreadConstraint plugin documentation: https://github.com/kubernetes-sigs/descheduler#removepodsviolatingtopologyspreadconstraint
- Pod topology spread constraints: https://kubernetes.io/docs/concepts/scheduling-eviction/topology-spread-constraints/
- Amazon EKS Best Practices Guide, reliability section: https://docs.aws.amazon.com/eks/latest/best-practices/reliability.html
- Horizontal Pod Autoscaler walkthrough (source of the hpa-example image): https://kubernetes.io/docs/tasks/run-application/horizontal-pod-autoscale-walkthrough/
- Amazon CloudWatch Container Insights: https://docs.aws.amazon.com/AmazonCloudWatch/latest/monitoring/ContainerInsights.html